Want to see it on a scenario of yours? →
End of the story. One forecast run of one scenario: one possible outcome under that day's forecast, not the only one.
ADRIA simulates oil spills on high-resolution regional forecasts: where the oil may go, how it weathers, which coast it reaches and when. Every run names the data behind it. Shown here on the scenario of POLex 2026, the international oil-spill exercise held in Koper.
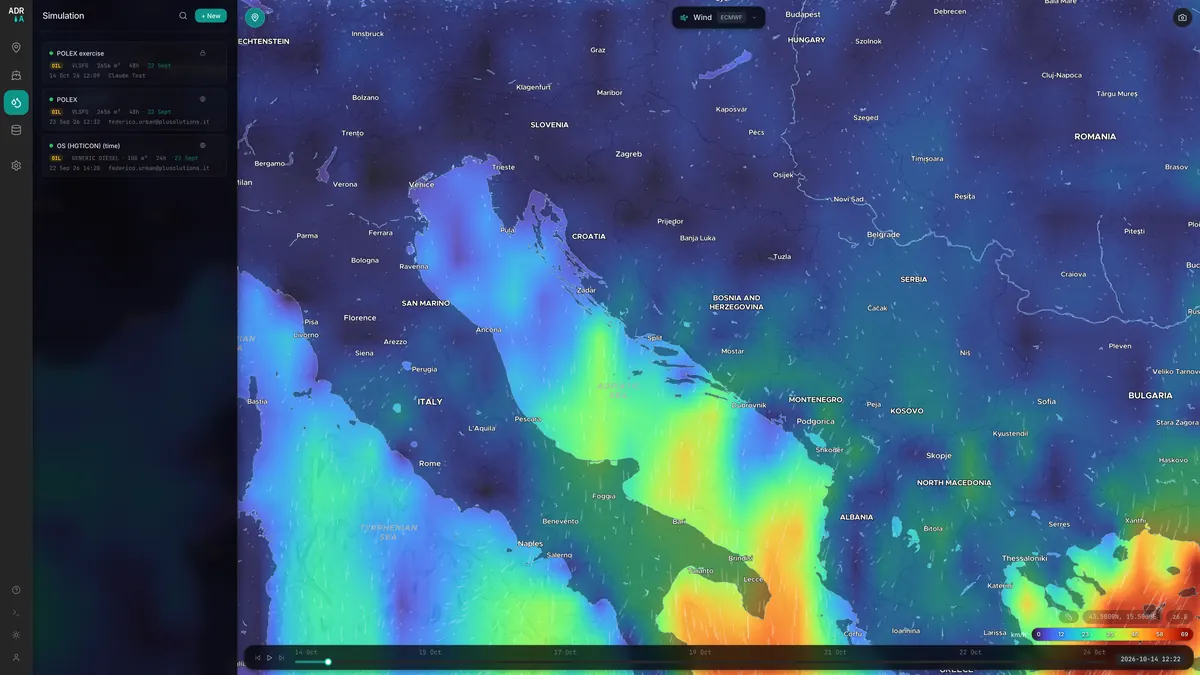
ADRIA shows currents, wind, sea temperature and biogeochemistry from the models of OGS, the Italian National Institute of Oceanography and Applied Geophysics, and of the Copernicus Marine Service as animated layers. On top of them it simulates drift: oil spills, search-and-rescue targets, passive tracers.
Each run records which data drove it, and its log names every source, down to the temperature of the water the oil weathers in.

The OGS MER forecast resolves the Gulf of Trieste bay by bay, so a slick feels the currents where it actually is. A Mediterranean model takes over beyond its edge.
Evaporation and viscosity are computed at each particle's position, with temperature and salinity from the same forecast.
Wind from the ~2 km OGS ICON model, interpolated to each particle's position; oil behaviour from NOAA's ADIOS library; the open OpenDrift engine.
Each run names its forecasts and bulletins in the log, the exported map and the PDF report. It names any backup model behind the main one and, where a forecast ends early, the hour the backup takes over.
Afloat, ashore, submerged, evaporated and dispersed are checked against the oil released, and the log flags any gap above 1%. In this run they sum to 2,500 t.
A simulation is only as good as the data behind it, and a responder must be able to check that data. ADRIA writes it down in plain words for every run. This is the log of the example below.
It is also honest about what it does not know. Each result is one plausible outcome of one forecast, and the limits are stated on this page, not left in the small print.

# Excerpt from the run log, lightly reformatted MER backed by a wider-domain reader (cmems: cmems_mod_med_phy-cur_anfc_4.2km) for particles leaving the domain CURRENTS VERIFIED: MER_HGT in use (requested: mer_hgt) — MER HGT b20260922 (51h @ 0.5m) SEA TEMPERATURE VERIFIED: MER_HGT — MER HGT b20260922 @ 0.5 m, 23.2–24.1 °C at the release salinity 37.6–38.3 PSU at the release Wind: OGS ICON b20260922 (~2 km) — 30x25 grid, 51 hourly steps, avg 2.3 m/s Oil type: VLSFO → ADIOS: AMSA Average Very Low Sulfur Fuel Oil (VLSFO) Seeded 531 particles at (45.574, 13.717) — continuous release over 41.6667h of a 48h simulation Oil budget: surface 1728.9, submerged 0.0, dispersed 3.3, evaporated 261.7, stranded 506.1 t
POLex 2026 was the international marine-pollution response exercise held on 23–24 September 2026 in Koper and Slovenian waters of the northern Adriatic, led by the Slovenian Maritime Administration under the Interreg IPA ADRION project ASAP. Its scenario: a collision in the Koper anchorage area leaves a ship leaking fuel oil at 60 t/h, 2,500 t in total. ADRIA was presented at the event with a simulation of that release, at anchor berth A1 of the Koper anchorage, on the forecast for 22–24 September. The simulated leak starts on 22 September at 10:00, 27 hours before the scenario's collision time.
| Release point | 45° 34.460′ N · 13° 43.000′ E |
| Start | 22 Sep 2026 · 10:00 CEST |
| Product | VLSFO · ADIOS AD02580 · 941 kg/m³ |
| Quantity | 2500 t ≈ 2656 m³ · 60 t/h for 41.7 h |
| Simulated | 48 h · 5-min steps · 531 particles |
| Currents | OGS MER, Gulf of Trieste high-res (~100 m grid); CMEMS behind it |
| Wind | OGS ICON (~2 km) · light, 2.3 m/s on average |
| Sea | OGS MER · 23.2–24.1 °C, 37.6–38.3 PSU at the release |
| Coastline | OpenStreetMap, high resolution |
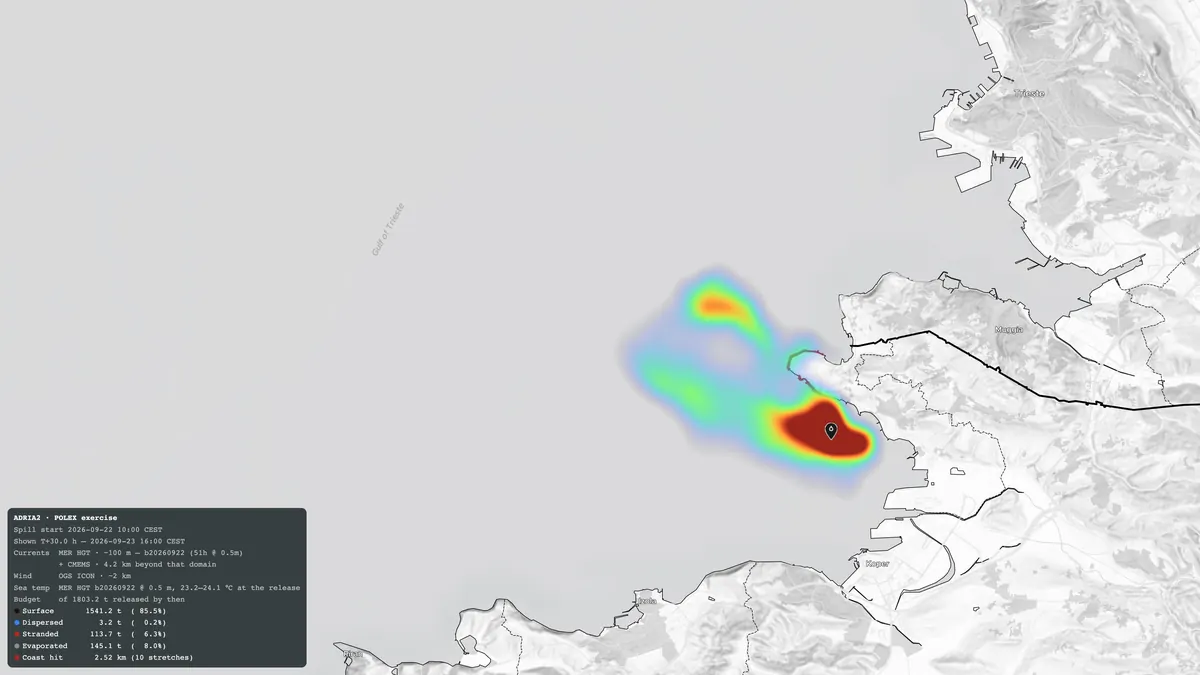
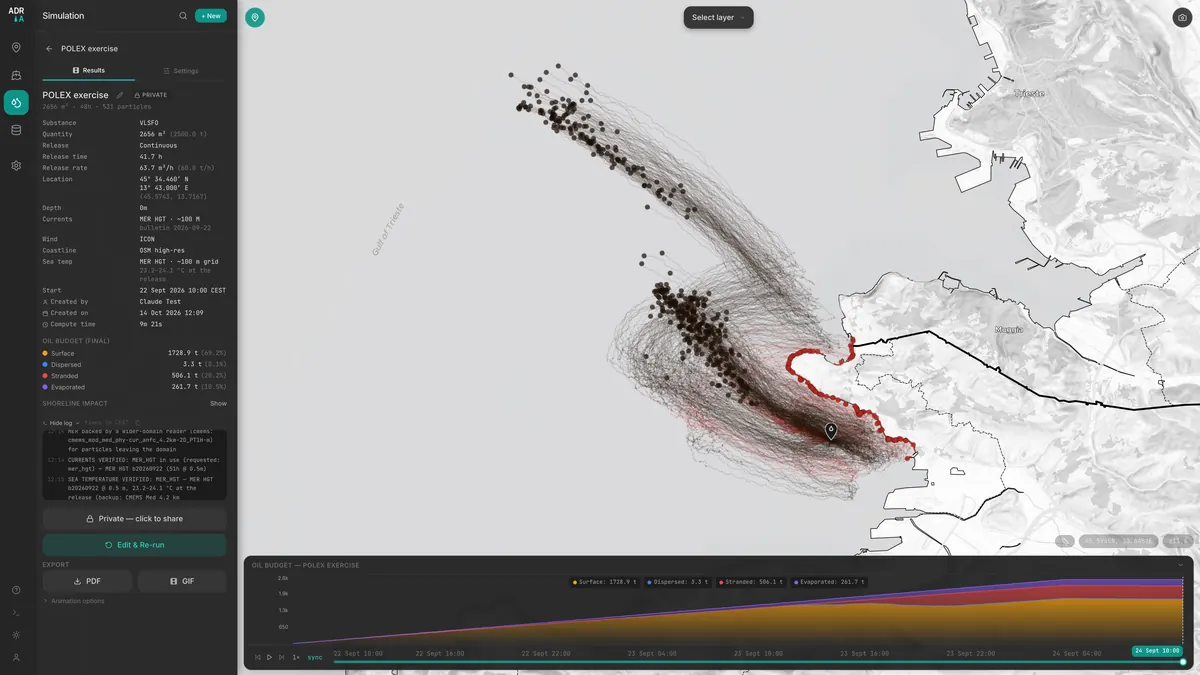
Each frame is the ADRIA simulation of the POLex 2026 scenario at that hour. The numbers under the map follow the clock.
Want to see it on a scenario of yours? →
End of the story. One forecast run of one scenario: one possible outcome under that day's forecast, not the only one.
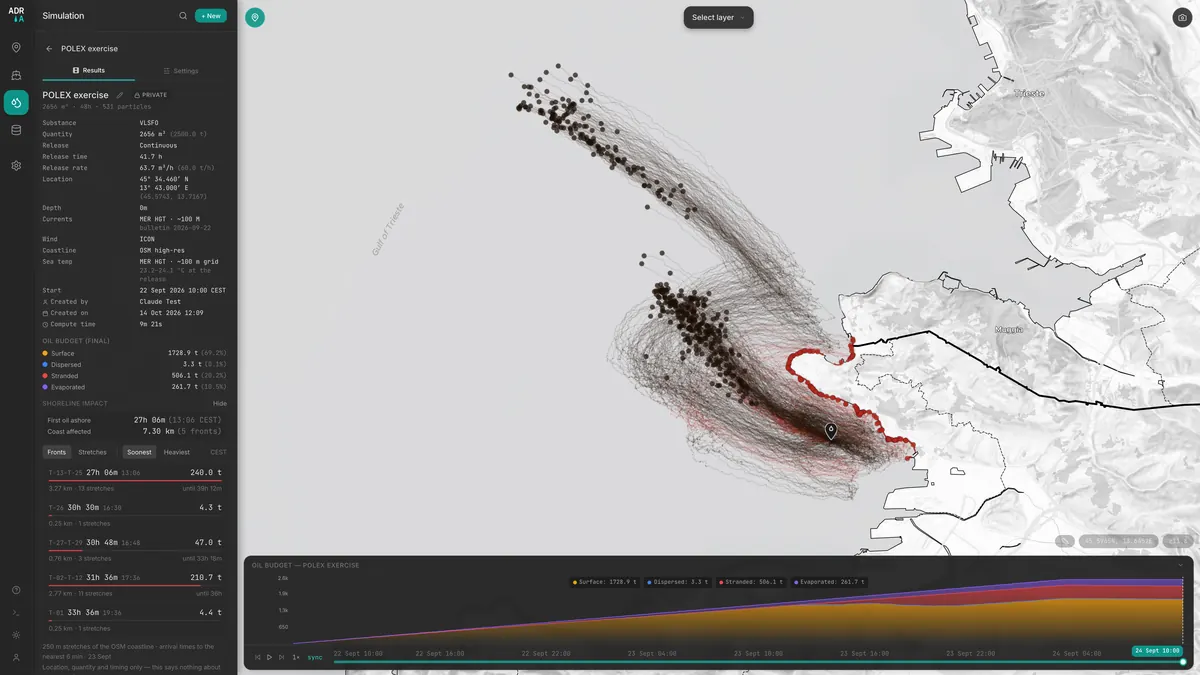
Trajectories: dark afloat, red ashore. Footprint: where the oil has been so far, by mass, relative to the brightest area. Colour by age: blue fresh, red two days old.
In this run, first oil came ashore about 27 hours after the release began. That reflects the light wind of that day's forecast. The source is about 1 km from the coast, and a different wind could bring oil ashore within hours.
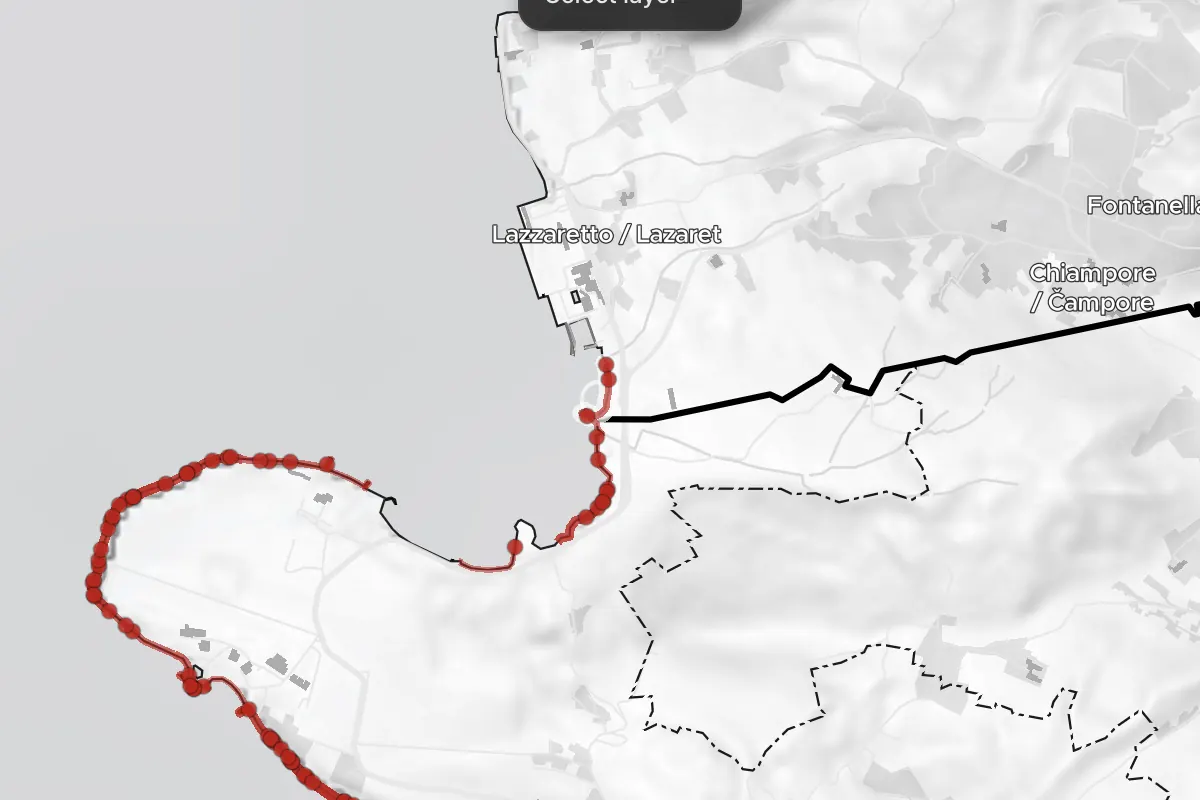
Once oil started to arrive, every landing in the run came within about 12 hours, along several kilometres of coast in Slovenia, and marginally across the border in Italy: from about T+33 h, roughly 13 t reach Lazzaretto (Muggia).
| Front | Where | Oil ashore | First oil |
|---|---|---|---|
| T-13 → T-25 | Debeli Rtič headland and both flanks (SI) | ~240 t | T+27.1 h |
| T-02 → T-12 | southern shore, towards Ankaran (SI) | ~210 t | T+31.6 h |
| T-27 → T-29 | north side, up to and across the border (SI/IT) | ~45 t | T+30.8 h |
| T-26 | north side (SI) | ~5 t | T+30.5 h |
| T-01 | southern shore, near Ankaran (SI) | ~5 t | T+33.6 h |
The exercise planners assumed about 500 t ashore. This run puts roughly 500 t ashore too, and the run shown at the event about 480 t. These are planning figures beside one forecast run, not a check of either. Each model particle carries about 4–4.5 t, so some of the coast shown rests on single particles. The analysis gives location, quantity and timing only; it says nothing about the type of shore, its sensitivity or how to reach it.


A total says how bad the spill is. This panel answers the operations-room question: where to send the crews, and in what order.
The coast is cut into numbered stretches. Each gets the oil that landed on it and the time the first oil arrived.
Adjacent stretches become fronts, the way a responder thinks of a coast. POLex: 29 stretches, 5 fronts.
Arrival order for acting now; tonnage order for allocating resources (below ~10 t the order is not meaningful).
Stretches light up on the map only when oil reaches them; a "not yet ashore" line moves down the list.
Point at a row and its stretch lights up; click it and the playback jumps to the moment oil arrives there.
| Afloat | 1728.9 t | 69.2 % |
| On the shore | 506.1 t | 20.2 % |
| Evaporated | 261.7 t | 10.5 % |
| Dispersed into the water | 3.3 t | 0.1 % |
| Submerged, could resurface | 0.0 t | 0 % |
| Total | 2500.0 t | 100 % |
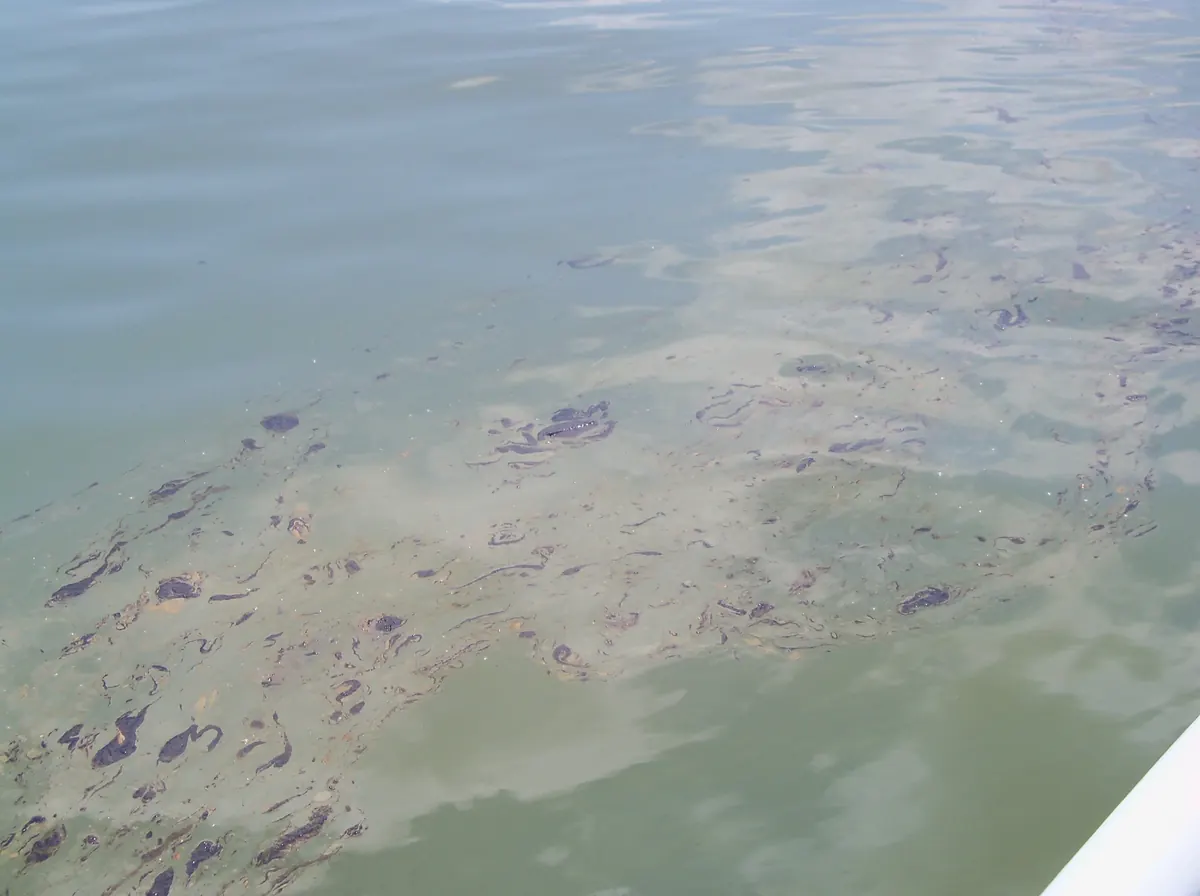
VLSFO is a heavy fuel: only its lighter fractions evaporate. With light winds almost nothing was mixed into the water, so the oil stayed on the surface until it reached land. In earlier model tests with the same product and a steady 10 m/s wind, the model mixed most of the oil below the surface within 48 h. That is a different response problem, and the reason the forecast of the actual day matters.
Tonnes over time; the leak continues until T+41.7 h.
The same scenario computed without temperature data, at the engine's 10 °C default, evaporates far less than in the real ~24 °C water of the gulf:
| 10 °C assumed | 23–24 °C, MER | |
|---|---|---|
| Evaporated after 48 h | 152.5 t | 261.7 t |
| Oil viscosity, fresh → 48 h | ~5,700 → 12,700 cSt | ~1,200 → 5,800 cSt |
ADRIA reads the sea temperature and salinity at the spill from the same ocean model as the currents, and states them in every run.
POLex 2026 brought together the Slovenian Maritime Administration, civil protection, the Port of Koper, the Italian coast guard and EU agencies around one spill. The exercise procedures include a modelling step: forecasting where the spill will move. That is the step ADRIA serves. Each actor has its own question, and the same run answers each of them.
| Who | Their question | What ADRIA gives |
|---|---|---|
| Maritime authority, VTS / MRCC | Where is the oil going, hour by hour? | The trajectories, on the latest forecast |
| Civil protection, municipalities | Which stretch of coast is hit, how much, and when? | Shoreline impact: in this run, first oil ashore about 27 h after the leak starts, in five fronts around the Debeli Rtič–Ankaran peninsula |
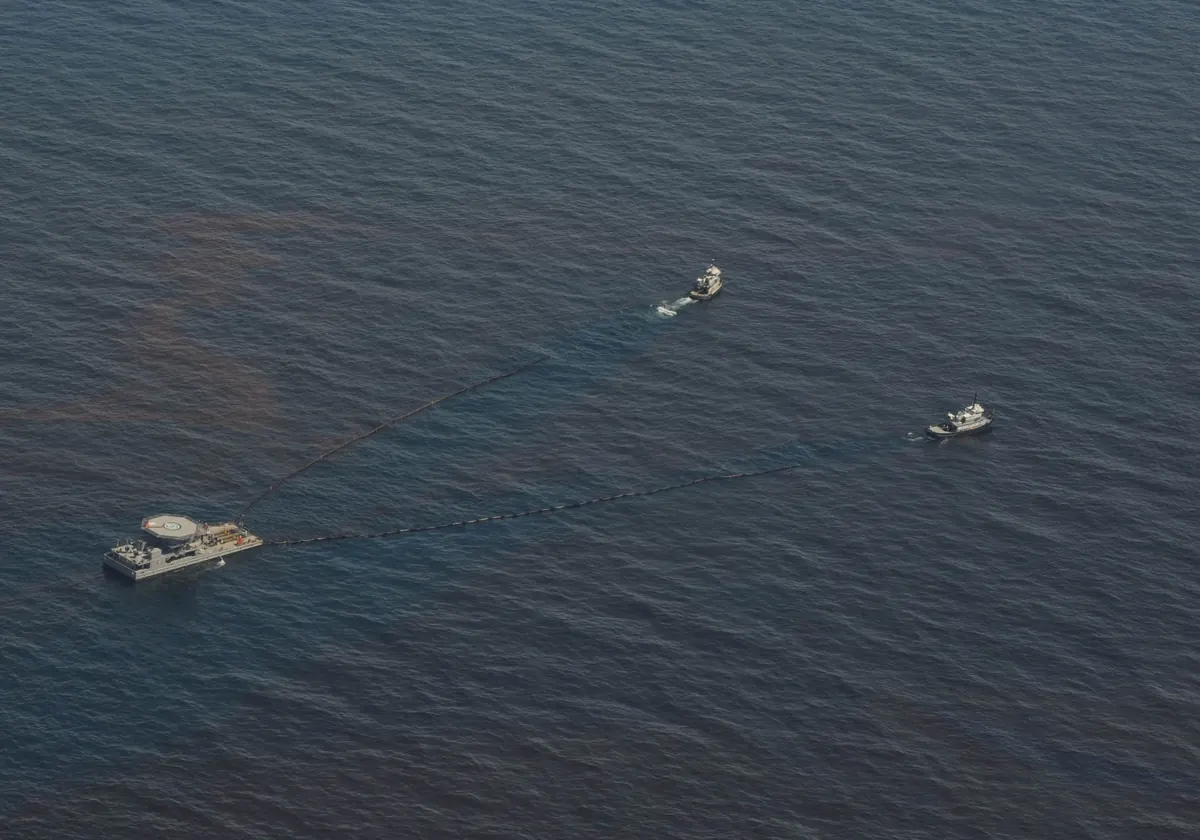
| Port and clean-up contractors | How much oil stays on the surface to recover? | The budget: about 1,730 t still afloat after 48 h (oil mass; the volume recovered with water is larger), 260 t evaporated |
| Neighbouring states | Will it cross the border, and when? | A few particles (about 13 t) land at Lazzaretto (IT) from about T+33 h: in this forecast, the border is within reach |
| Planners | What if the wind or the oil is different? | Re-run in about 10 minutes with another forecast, oil or release point |
ADRIA was presented at POLex 2026 with this simulation; it was not part of the exercise response. The figures are from one forecast run.
In the browser, nothing to install. Runs are private or shared with the team.
Click the map or type coordinates. Choose the oil, quantity, release pattern, start time, and the current and wind sources.
A calendar shows which models cover each day at that exact point.
Play the result hour by hour, with the oil budget and the shoreline impact.
Switch views, export a map, a PDF or an animation, or re-run with another oil or forecast.

For a demonstration, a simulation of a scenario that matters to your organisation, or information on how ADRIA could support your planning and exercises, write to the team.
demo@adria.live
Opens your e-mail app with a short template: name, organisation, role and area of interest.